Free first chapter
Data Science Foundations
From Raw Data to Reproducible Insights
Read the first chapter in your browser. It's free, with no account and no email needed.
Free to read. No account required.
About this book
Data science often looks like a pile of disconnected tools: a bit of Python here, some statistics there, a chart somewhere else. This book connects them into one workflow, so you can take a messy dataset and arrive at an insight that someone else can reproduce.
You begin with the data science workflow, then learn how to acquire and store data and clean and wrangle real-world data. You practise exploratory data analysis and descriptive statistics, learning to interpret what you find rather than just calculate it. Hypothesis testing and experimental reasoning teach you how to judge whether a pattern is real. Visualisation chapters focus on charts that explain, and SQL gives you direct access to analytical data.
Project case studies bring the pieces together, and the final chapter covers reporting, reproducibility and building a portfolio. You finish understanding the full path from raw data to clear, repeatable results, and able to build it yourself.
Look inside
How to Use This Book
Work through the chapters in order. The goal is to build a complete workflow rather than isolated techniques.
Environment Setup
Use a reproducible Python or R environment with notebook support, versioned datasets, and a place to store project outputs and reports.
Reading Strategy
Move from data access and cleaning into statistics, visualization, and full project work. Complete the project exercises to build usable portfolio artifacts.
The Data Science Workflow
A junior analyst at a mid-size retailer spends two weeks building a churn prediction model. The accuracy looks good. The dashboard is polished. When the VP of marketing asks, "So which customers should we contact this week, and why?" the analyst freezes. The model produces scores, but the analyst never defined what decision the scores were supposed to support. Two weeks of technical work, and the project cannot answer the question that mattered.
This is not a skills problem. It is a workflow problem. The analyst had the tools but skipped the step that makes everything else useful: framing the question before touching the data.
- Explain what data science includes beyond modeling and dashboards
- Break a project into six explicit stages: framing, acquisition, cleaning, analysis, interpretation, and communication
- Define the minimum artifacts required for reproducible analytical work
- Distinguish disciplined project execution from ad hoc analysis
- Identify common failure modes that derail data science projects
What Data Science Actually Includes
Data science is not a single technique. It is a discipline that connects questions to evidence through data, computation, and communication. Many beginners treat it as synonymous with machine learning or dashboard building. Both are tools within data science, but neither defines it.
A useful definition: data science is the practice of extracting defensible conclusions from data through a structured process of acquisition, cleaning, analysis, and communication. The word defensible matters. Anyone can produce a number. The challenge is producing a number that holds up to scrutiny, that another analyst can reproduce, and that a decision-maker can act on with confidence.
Consider the distance between "our revenue went up 12% last quarter" and "our revenue increased 12% quarter-over-quarter, driven primarily by a 23% increase in the enterprise segment, which we attribute to the revised pricing tier introduced in January; the consumer segment declined 4%, consistent with the seasonal pattern observed in the prior two years." The first statement is a fact. The second is evidence — it identifies the driver, isolates segments, accounts for confounding patterns, and provides enough context for someone to evaluate whether the conclusion is credible. Data science is the practice that turns facts into evidence.
What Data Science Is Not
It helps to draw boundaries.
Data science is not ad hoc spreadsheet analysis. Spreadsheets are useful, but a one-off analysis in a spreadsheet with no version control, no documented assumptions, and no reproducibility is not data science. It is a calculation. If you cannot tell someone exactly what steps you followed, what data you used, and what choices you made along the way, you have produced a result but not evidence. The distinction matters because calculations can be wrong in ways that are invisible to the person who made them, and there is no mechanism for anyone else to catch the error.
Data science is not reporting. A weekly sales report summarizes what happened. Data science asks why it happened, whether the pattern will continue, and what action the evidence supports. Reporting describes. Data science investigates. A reporting dashboard that shows last month's revenue by region is valuable, but it does not tell you why the Northeast region underperformed or whether the pattern will reverse next month. Data science starts where reporting stops — at the point where someone needs to make a decision and the existing summaries are not enough.
Data science is not machine learning alone. A trained model is one component of a larger process. Without clean data, a well-framed question, and clear communication of results, even a high-accuracy model produces no value. The model is an engine. Data science is the entire vehicle — the frame, the steering, the navigation system, and the driver who knows where to go.
The Three Pillars
In practice, data science rests on three pillars:
- Domain knowledge. You need to understand the context well enough to ask the right question and interpret the answer. A statistically significant result that has no practical meaning is a waste of effort. Domain knowledge tells you which variables matter, which comparisons are meaningful, and what magnitude of effect would actually change a decision. An analyst studying hospital readmission rates needs to understand clinical workflows and patient demographics — not just regression coefficients. Without that understanding, the analysis may be technically correct and practically useless.
- Technical execution. You need the ability to acquire, clean, transform, and analyze data using appropriate tools. This includes programming, statistics, and visualization. An analyst who can only compute averages will miss patterns that require segmentation, time-series decomposition, or multivariate modeling. Technical depth is not about using the most advanced method — it is about having enough range to choose the right method for the question.
- Communication. You need to present findings in a way that decision-makers can understand and act on. A brilliant analysis that no one reads has zero impact. Communication includes writing, visualization, and the ability to tailor technical detail to the audience. A memo for the CFO looks different from a code review for a fellow analyst. Both require skill; both determine whether the work creates value or disappears into a shared drive.
Most training focuses on the second pillar. This book treats all three as essential.
Evidence production vs. output production. Producing a chart, a table, or a model prediction is output production. Producing a defensible answer to a specific question — with documented data, transparent methods, and honest uncertainty — is evidence production. Data science aims for evidence, not just output.
Consider two analysts asked to evaluate whether a new onboarding flow improves user activation. Analyst A produces a bar chart comparing activation rates before and after the launch and writes "activation improved." Analyst B segments by acquisition channel, controls for a concurrent marketing campaign, reports confidence intervals, and writes "activation improved by 3.2 percentage points (95% CI: 1.1 to 5.3) after controlling for channel mix and the May email campaign; the effect is concentrated in organic signups and is not statistically significant for paid acquisition users." Analyst A produced output. Analyst B produced evidence. The decision-maker can act on B's work.
The Path from Question to Conclusion
Every data science project follows a path. The steps may overlap, repeat, or compress, but the path always exists. Skipping stages does not save time. It creates rework, broken trust, and results that cannot survive review.
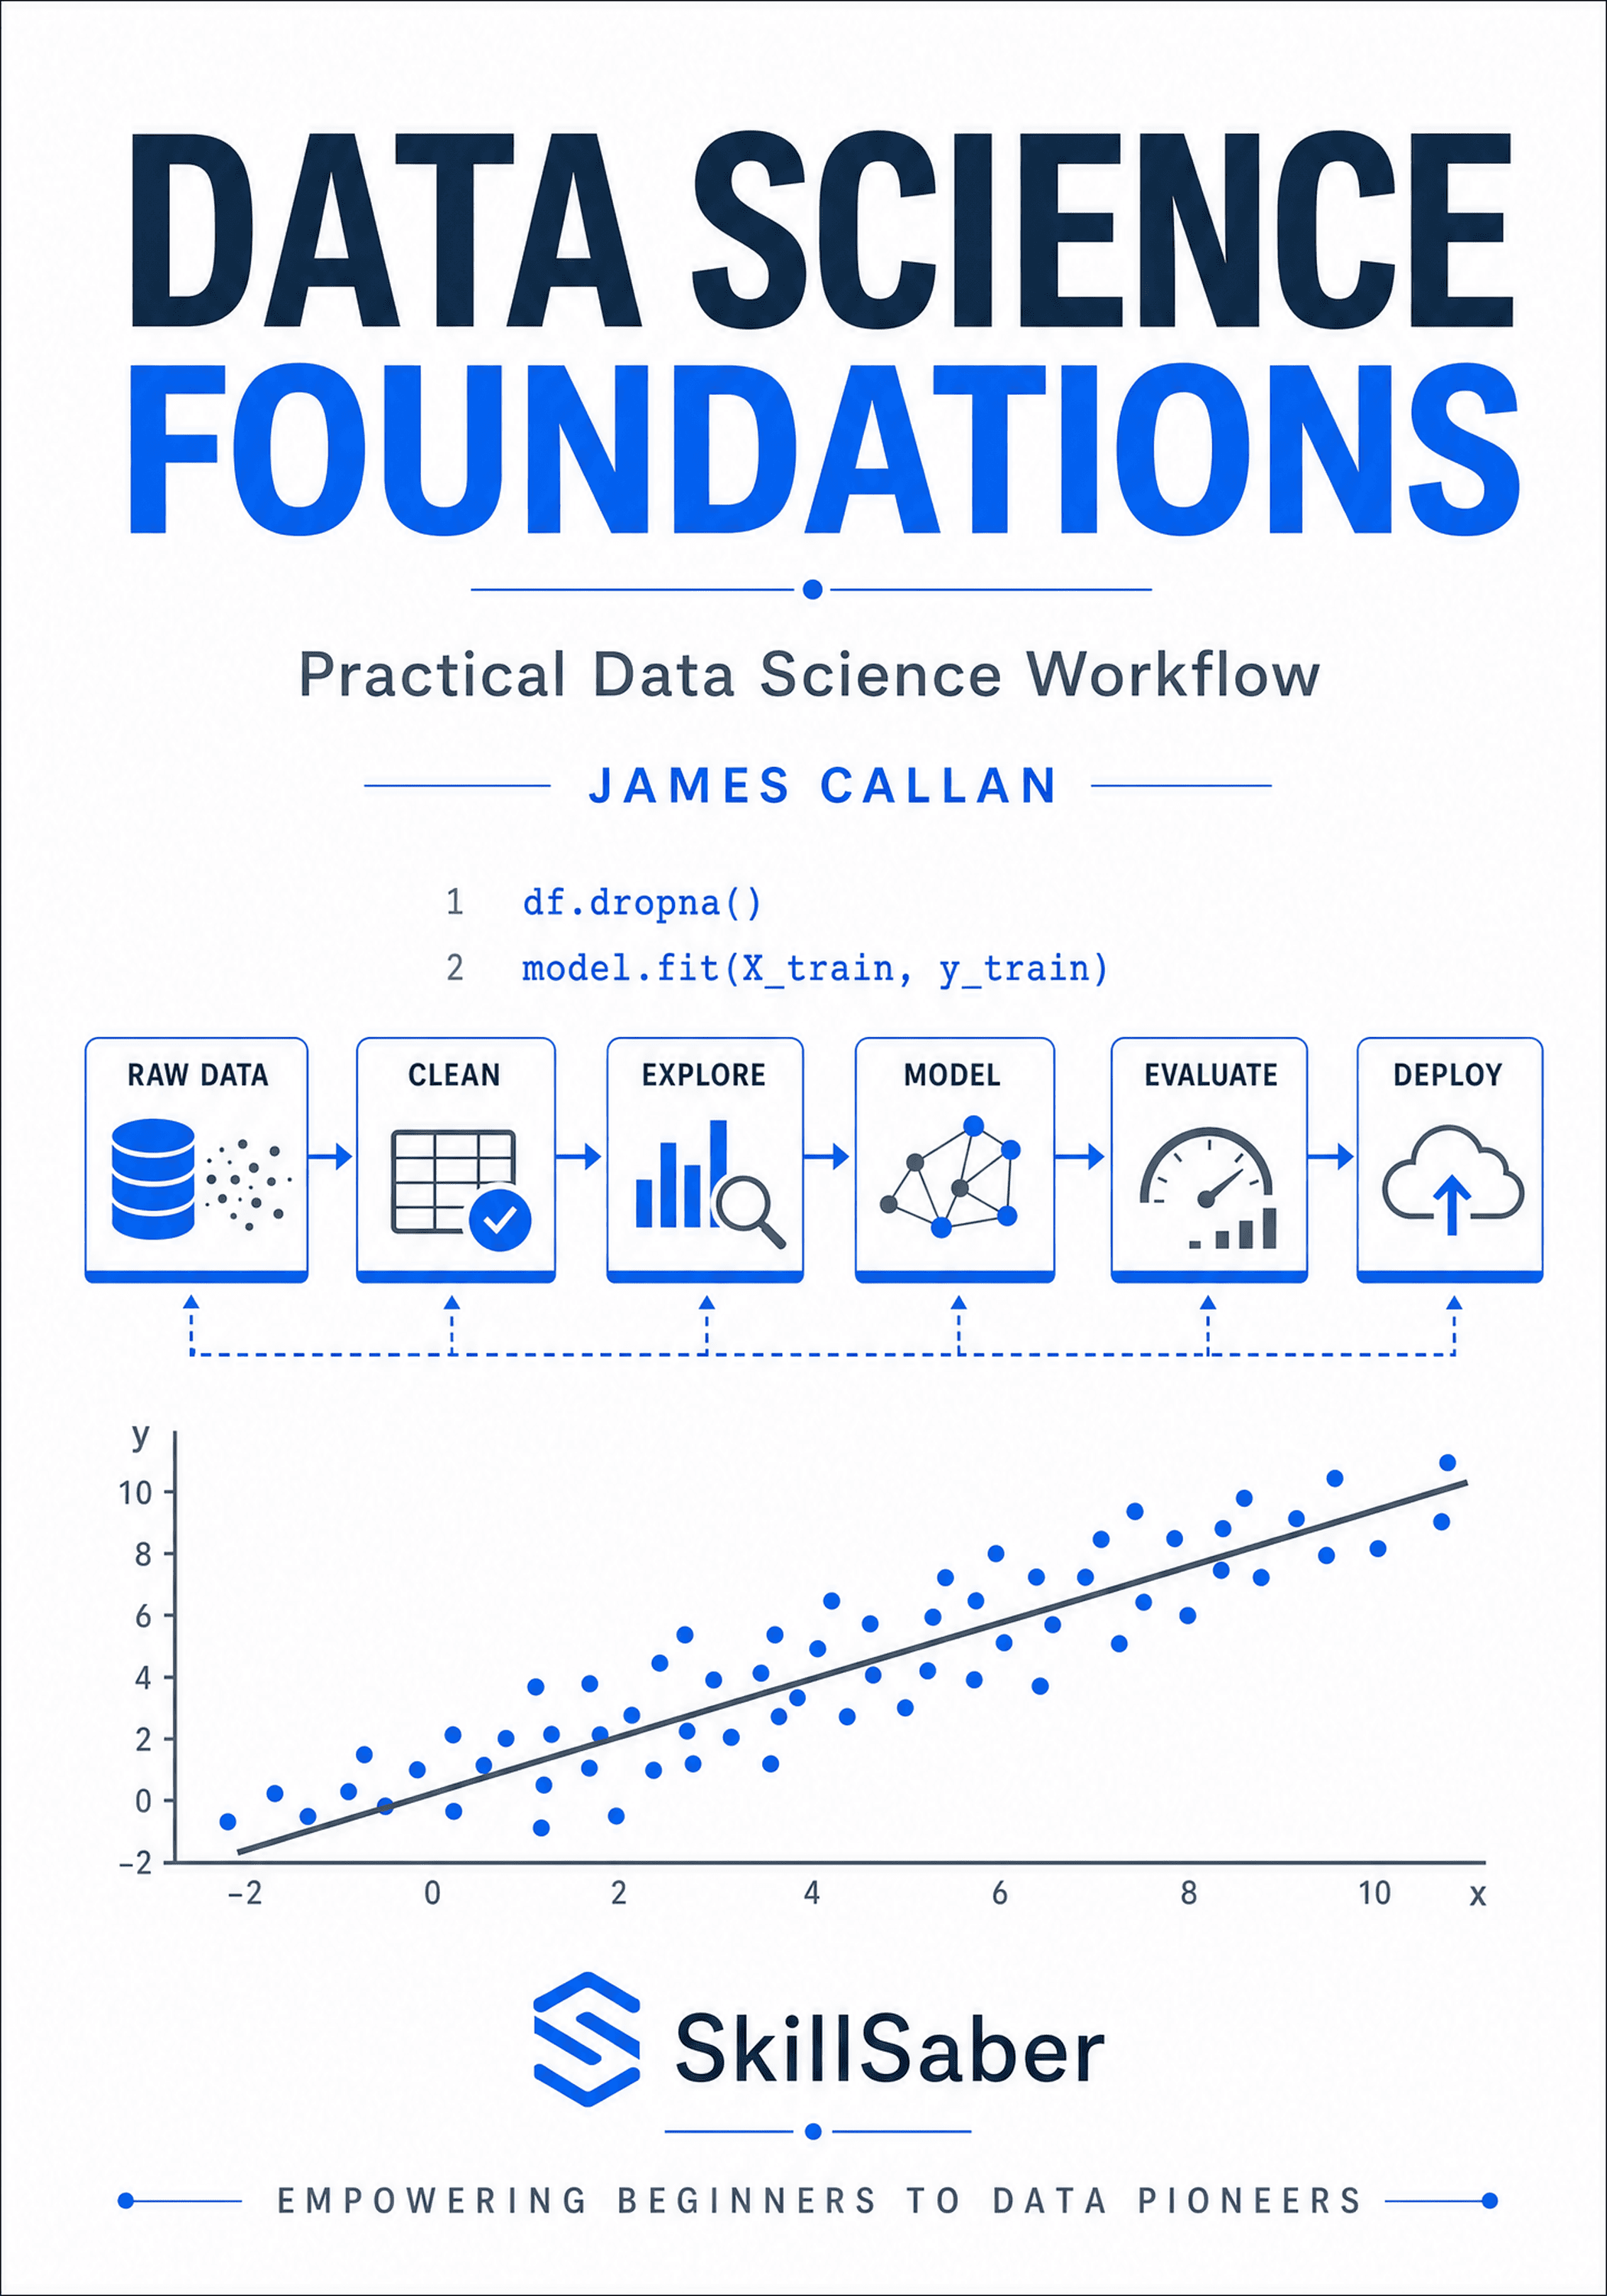
The workflow has six stages plus a review loop:
Stage 1: Frame the Question
The most important step happens before any code runs. Framing means defining:
- What decision will this analysis support? If no decision depends on the result, the project has no purpose. This does not mean every analysis must lead to an immediate action — exploratory research has value — but even exploration should have a defined goal. "Understand the relationship between customer tenure and lifetime value" is a legitimate framing. "Look at the data and see what's interesting" is not.
- What would a useful answer look like? Defining the shape of the answer prevents scope creep and wasted exploration. If the answer is a single number (estimated revenue impact), you know you need different data and methods than if the answer is a ranked list (top five factors driving churn) or a segmentation (three distinct customer behavior profiles).
- What data would we need to answer this? This forces you to think about feasibility before committing effort. If the data does not exist, is too expensive to acquire, or has known quality problems that cannot be resolved, you need to know that before spending two weeks on an analysis that will collapse in Stage 2.
- What assumptions are we making? Stating assumptions early makes them testable later. Common assumptions include: the data is representative of the population we care about, the time period is long enough to capture the pattern, the definitions we use match what the business means by the same terms, and the relationships we observe are stable enough to be useful going forward.
Free to read. No account required.