Free first chapter
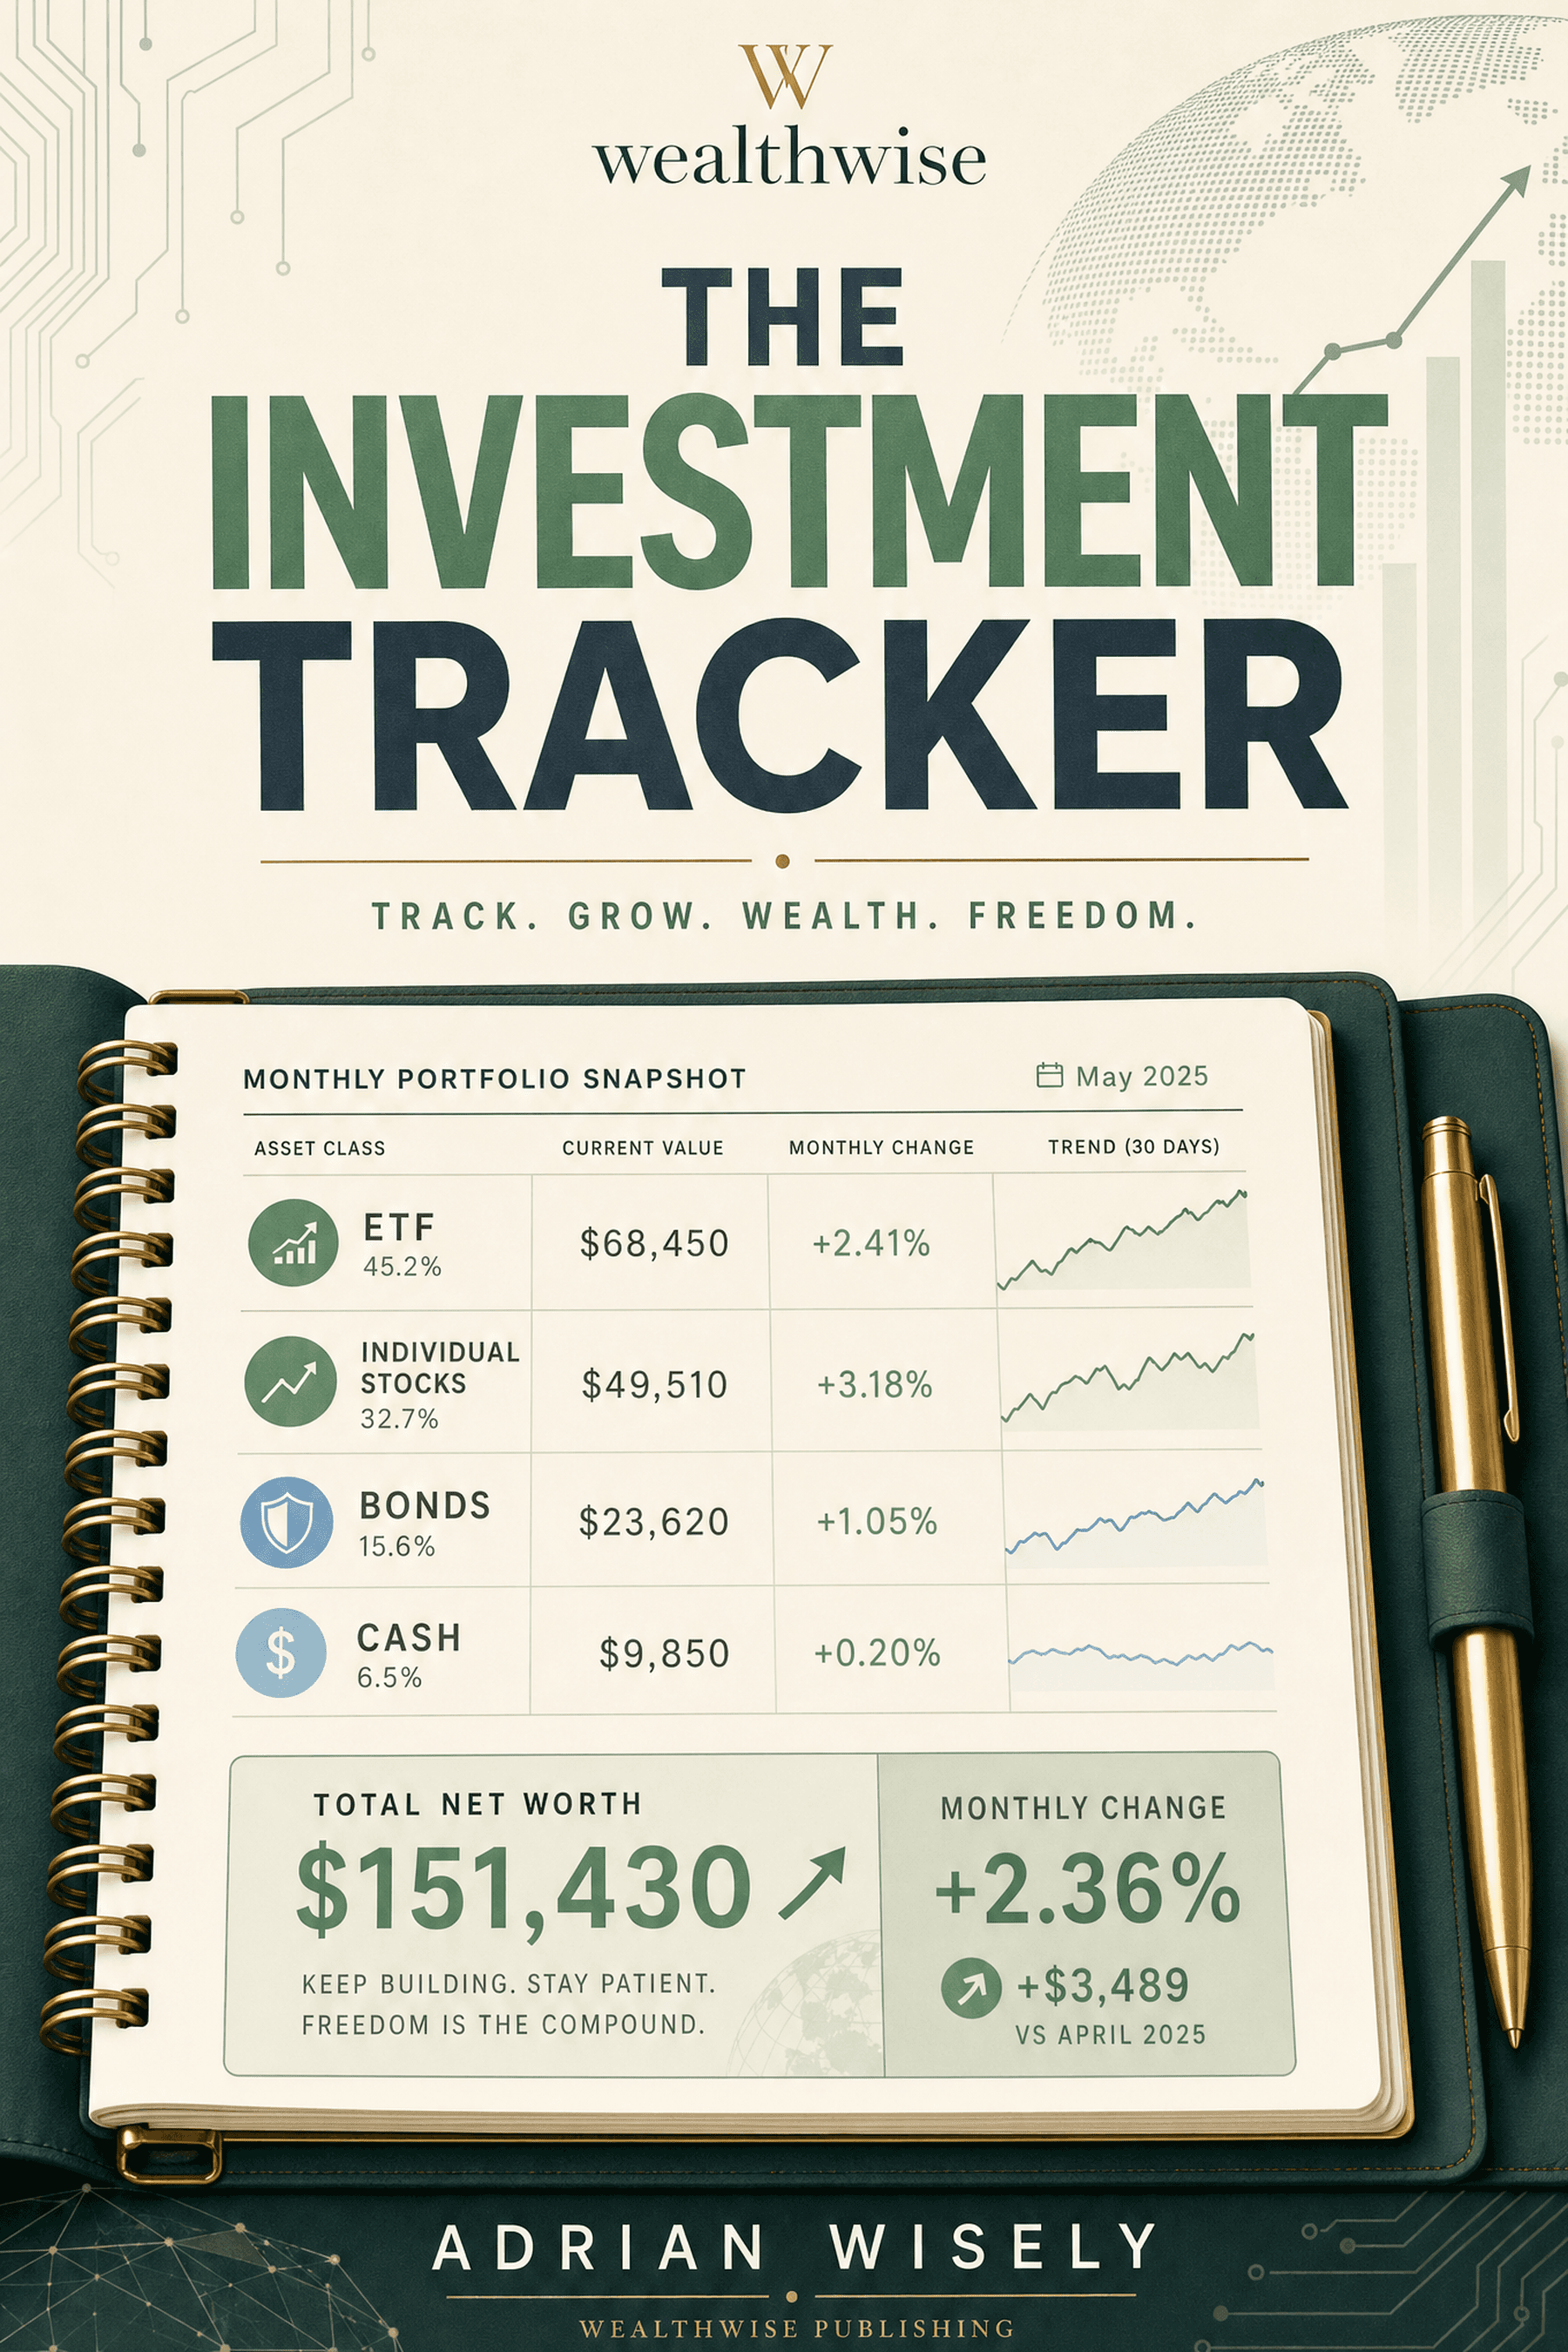
The Investment Tracker
Monitor Your Portfolio, Dividends, and Net Worth Growth
Read the first chapter in your browser. It's free, with no account and no email needed.
Free to read. No account required.
About this book
Checking a brokerage app tells you what is happening now, but not what you did and when. This tracker is a place to record your investing deliberately, whether you hold one retirement account or several accounts and asset types.
You start with an account overview, one page per account. A holdings log records each investment's ticker, asset class, purchase date, shares and cost basis. A transaction log captures every buy, sell, dividend or transfer. A dividend tracker records ex-dates, pay dates and amounts received. Each month you jot down a portfolio snapshot with your asset allocation, and a net worth tracker lists your assets and liabilities. An annual review sums up contributions, dividends and your best and worst holdings.
It is a record-keeping tool for your own figures and does not recommend any investment.
Look inside
Your Portfolio Deserves More Than a Glance at an App.
The average American investor checks their brokerage app 9 times per day during volatile markets and almost never during calm ones. Neither habit is particularly useful. Checking constantly feeds anxiety. Ignoring your portfolio entirely means you might miss that your allocation has drifted, your dividends have grown, or your net worth has quietly crossed a milestone you set three years ago.
This tracker sits in the middle. It's a place to record your investment activity deliberately — once per transaction, once per month, once per quarter. Not obsessively. Not neglectfully. Just consistently.
Who This Is For
This book is for anyone who invests their own money and wants a physical record of what they own, what they've bought, what they've earned in dividends, and how their net worth is changing over time.
It works whether you have a single Roth IRA with three index funds or a complex setup with multiple brokerage accounts, individual stocks, ETFs, bonds, and crypto. It's designed for the self-directed investor who wants to see the big picture without logging into four different apps.
You don't need to be a professional trader. You don't need to understand options pricing. You just need to own investments and want to track them clearly.
How It Works
Account Overview. Start by listing each investment account: your 401(k), Roth IRA, taxable brokerage, HSA, crypto exchange — whatever you use. One page per account. Note the brokerage, the account type, your annual contribution goal, and your beneficiary.
Holdings Log. Each investment you own gets its own page. Record the ticker, the asset class, your purchase date, number of shares, and cost basis. When you buy more shares (dollar-cost averaging), add a new row. Update the current value monthly. The gain/loss calculation is simple subtraction: Current Value minus Total Cost Basis.
Transaction Log. Every time you buy, sell, receive a dividend, or transfer money, log it here. One page per month, fifteen rows per page. This is your complete record of investment activity.
Dividend Tracker. If you own dividend-paying stocks or funds, this section tracks every payment — the ex-date, pay date, dividend per share, shares held, and total received. Over time, this section becomes deeply satisfying. Watching your quarterly dividend income grow from $12 to $50 to $200 is one of the most concrete ways to see compounding at work.
Monthly Portfolio Snapshot. Once a month, record your total portfolio value, your asset allocation (stocks, bonds, cash, crypto, other), and your monthly return. There's a field to write in the S&P 500 return for comparison, but that's optional. The point is awareness, not competition.
Net Worth Tracker. This section zooms out from investments to your full financial picture. List your assets (investment accounts, cash, property) and your liabilities (mortgage, loans, credit cards). Net worth is the difference. Track it monthly, and you'll see the trajectory that matters most.
Annual Review. At year end, summarize your total contributions, dividends received, and overall gain or loss. Note your best and worst performers. Write down rebalancing plans and goals for the next year.
Why Paper?
You might wonder why you'd track investments on paper when every brokerage has an app with real-time data. The answer is that apps show you what's happening right now. This book shows you what happened over time. It captures the decisions you made, the prices you paid, and the patterns you followed. A year from now, you'll be able to flip back and see exactly when you started investing, how your allocation evolved, and what your net worth looked like at every step along the way.
That long view is hard to get from an app. It's easy to get from a book you filled in yourself.
Getting Started
Open to the Account Overview section. List every investment account you have. Then flip to the Holdings Log and record your current positions — what you own, how many shares, and what you paid.
That first snapshot is your starting line. Everything you track from here is progress.
Quotes to share
Checking a brokerage app tells you what is happening now, but not what you did and when.
Free to read. No account required.