Free first chapter
R for Statistical Programming
Data Wrangling, Visualization, and Statistical Modeling in R
Read the first chapter in your browser. It's free, with no account and no email needed.
Free to read. No account required.
About this book
If your analysis lives in spreadsheets, every new dataset means repeating the same clicks and hoping you remember each step. R lets you replace that with scripts you can rerun, check and share.
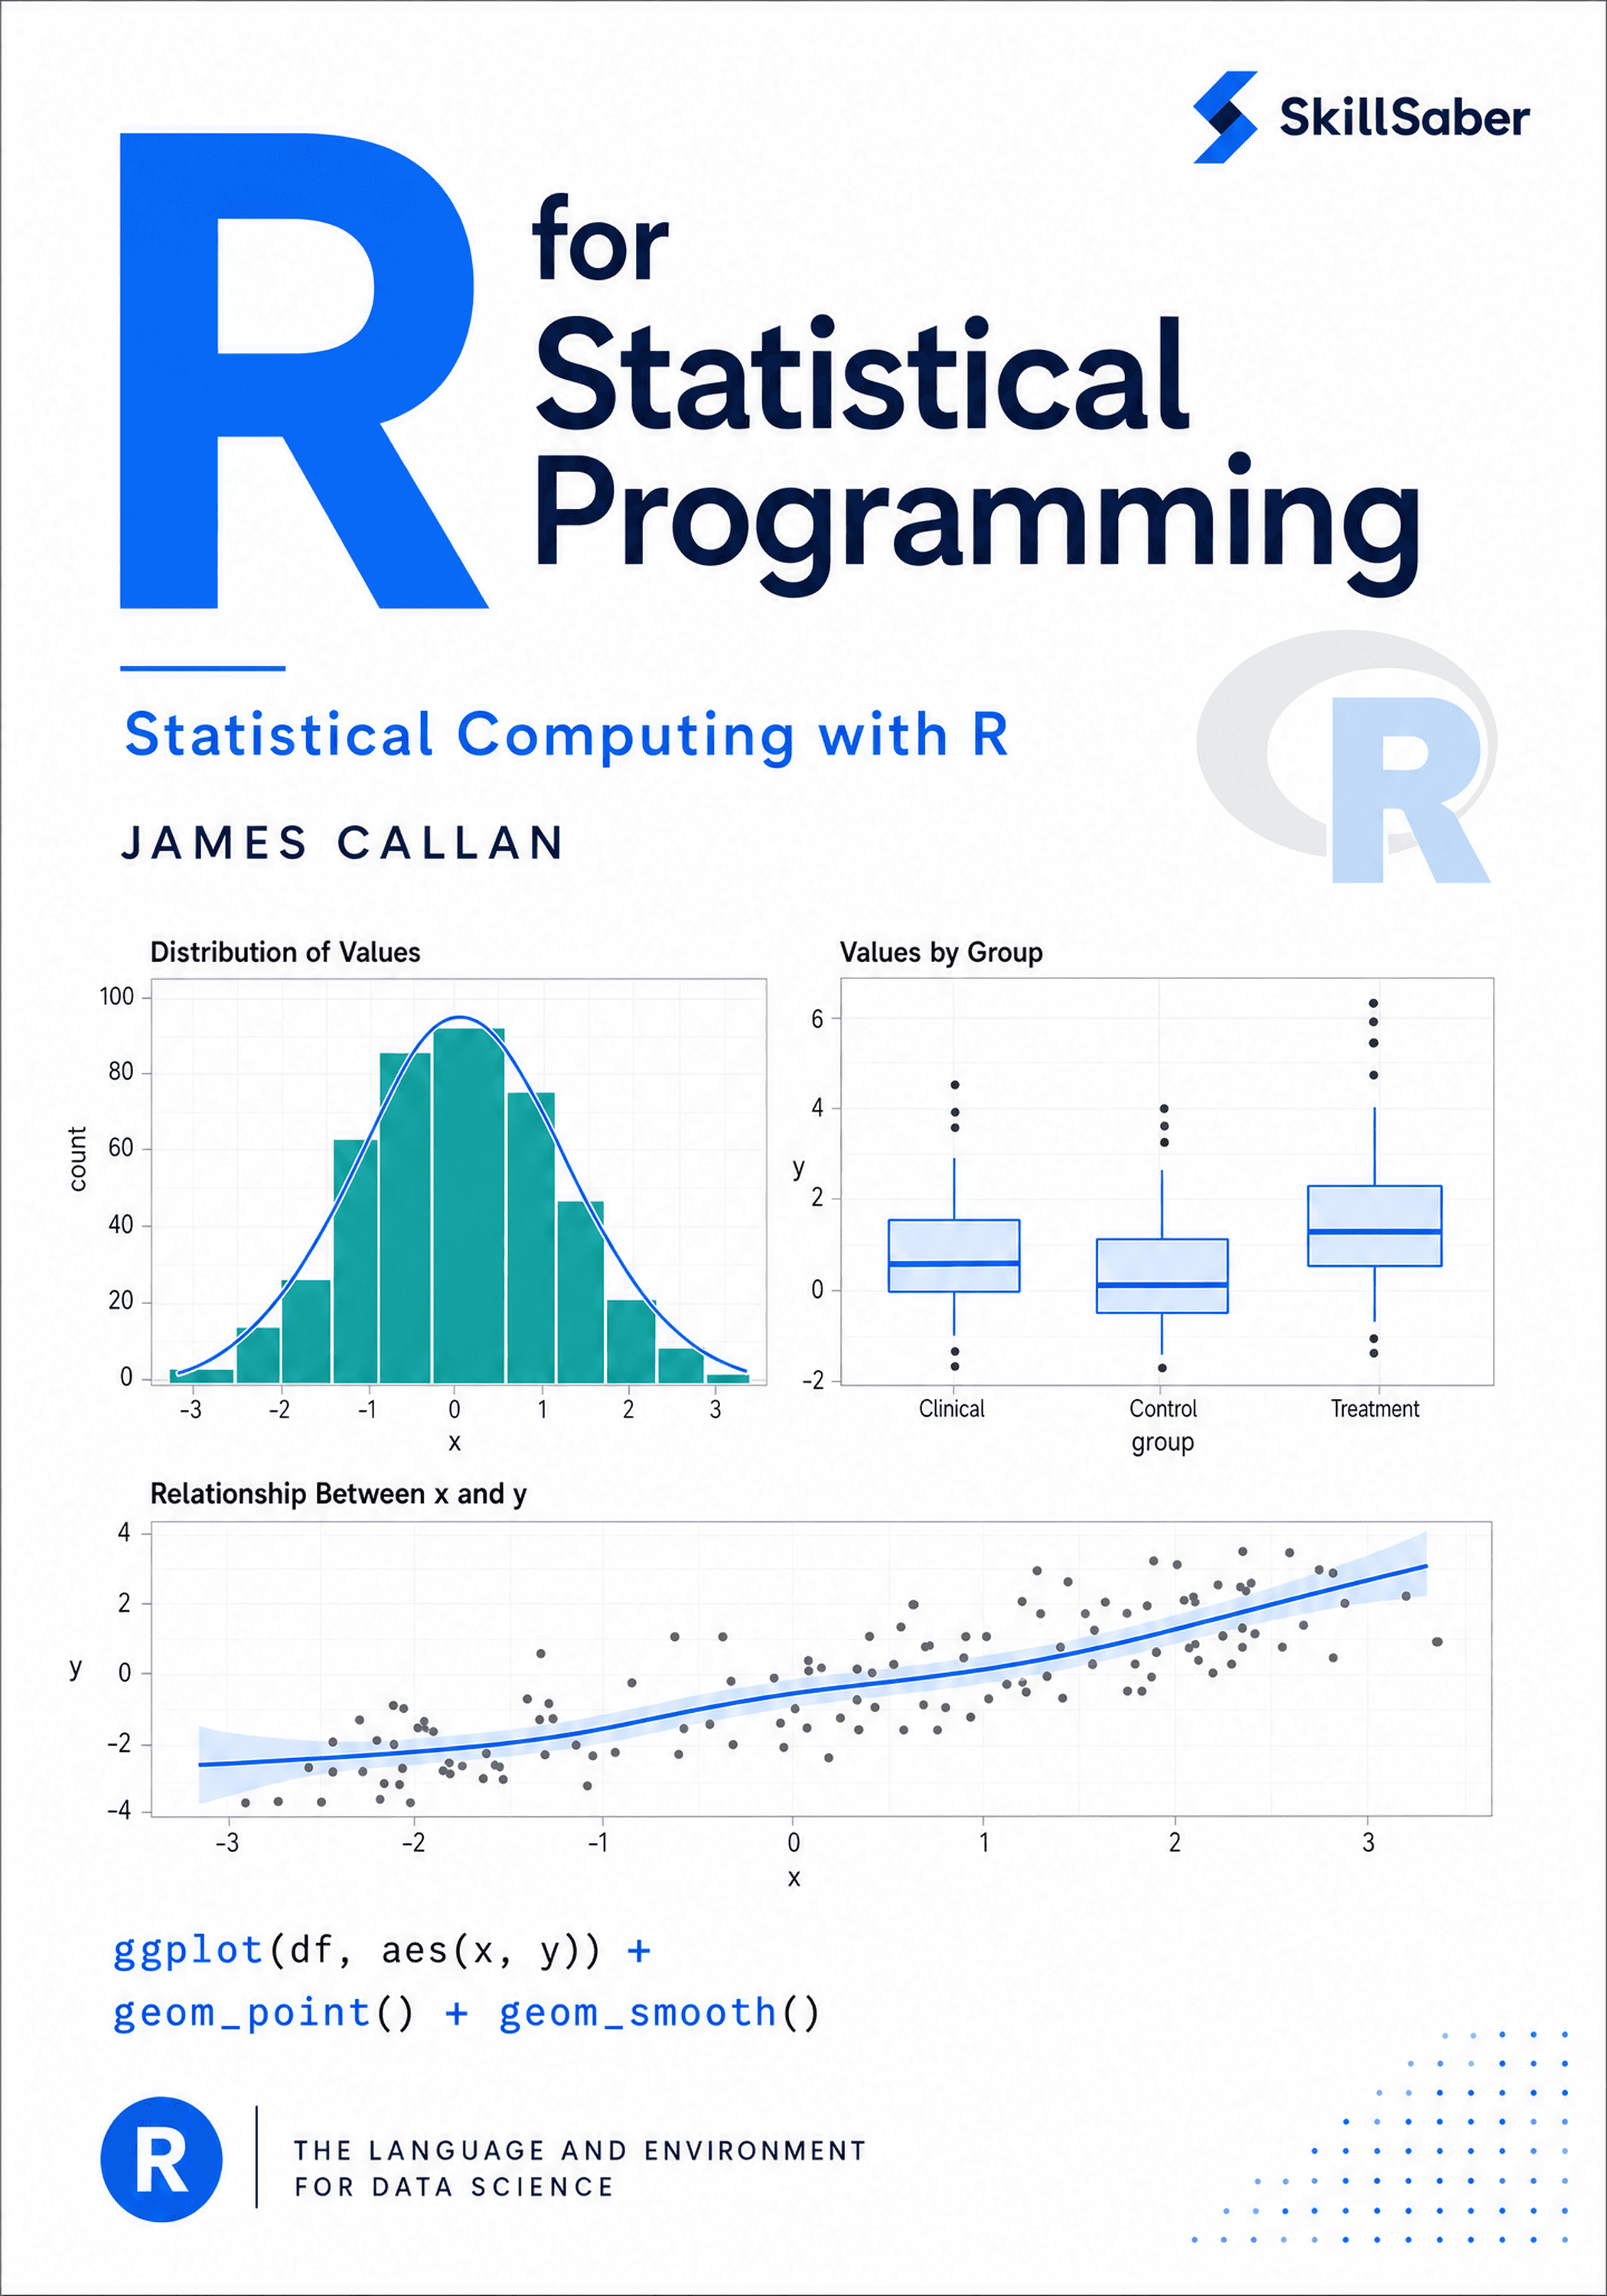
R for Statistical Programming takes you from first principles to a complete analysis. You begin with the R workflow, syntax and RStudio, then learn data import, objects and tidy data. You will wrangle messy data with dplyr and tidyr, visualise it with ggplot2, and explore it through descriptive statistics. The book then covers statistical tests and how to check their assumptions, and regression modelling in R. Later chapters show you how to produce reproducible reports with R Markdown and Quarto and build interactive analyses with Shiny.
Look inside
How to Use This Book
Work through the chapters in order on the first pass. The book is designed to replace manual spreadsheet habits with reproducible script-based analysis.
Environment Setup
Use a current R installation with RStudio or another editor, plus the tidyverse, Quarto, and testing packages appropriate for your workflow.
Reading Strategy
Type the code yourself, re-run examples on your own datasets, and treat reproducibility as a core skill rather than an extra publishing feature.
R Workflow, Syntax, and RStudio Foundations
A research assistant at a public health nonprofit spends three days analyzing survey data in a spreadsheet. She highlights rows, sorts columns, types formulas into cells, and copies results into a slide deck. When her supervisor asks her to rerun the analysis with an updated dataset, she realizes she cannot remember which rows she deleted, which filters she applied, or why one column is labeled "adjscorev2_FINAL." She starts over from scratch.
This is not a competence problem. It is a workflow problem. The analyst had the skills to do the work, but the tool she used — a spreadsheet driven by clicks and manual edits — could not record the decisions she made along the way. Every step vanished the moment she moved to the next one.
R solves this problem. Not because it is more powerful than a spreadsheet (though it often is), but because it forces you to write down what you did. A script is a record. A project is a container. Together, they make your analysis reproducible, auditable, and reusable.
- Explain what R is designed for and where it fits in an analytical workflow
- Set up an RStudio project with a disciplined folder structure
- Write and run R scripts that use core syntax: assignment, vectors, data frames, functions, and indexing
- Distinguish script-based analysis from click-driven spreadsheet work
- Apply reproducibility habits from the first line of code you write
What R Is For
R is a programming language built for data analysis, statistics, and communication. It was created by statisticians, and its design reflects that origin: working with data is the default activity, not an afterthought bolted onto a general-purpose language. When you start R, you are already in a statistical computing environment.
R's Core Strengths
R excels in several areas that matter for analysts and researchers:
Statistical analysis. R has the deepest ecosystem of statistical methods of any programming language. Linear models, generalized linear models, mixed-effects models, survival analysis, Bayesian inference, time series, spatial statistics — if a method exists in published statistics, someone has implemented it in R. For many methods, R is the reference implementation that other tools benchmark against.
Data visualization. The ggplot2 package, part of the tidyverse, provides a grammar of graphics that lets you build layered, publication-quality plots from a consistent set of principles. Instead of choosing from a fixed menu of chart types, you compose visual elements — geometries, scales, coordinates, and themes — to express exactly what the data shows.
Reproducible reporting. R integrates directly with Quarto and R Markdown to produce documents that combine code, results, and narrative. Your analysis and your report are the same file. When the data changes, the report updates automatically.
Community and packages. CRAN (the Comprehensive R Archive Network) hosts over 20,000 packages. The tidyverse — a coordinated collection of packages for data import, wrangling, visualization, and modeling — provides a consistent, readable interface for everyday analytical work. Bioconductor extends R for genomics and bioinformatics. Domain-specific packages exist for ecology, finance, psychometrics, epidemiology, and dozens of other fields.
Where R Fits — and Where It Does Not
R is not a general-purpose programming language. You would not build a web application, a mobile app, or an operating system in R. It is not designed for large-scale software engineering, and it is not the best choice for deploying machine learning models into production pipelines (though it can do so with additional tooling).
R is the right tool when:
- Your primary task is analyzing data and producing statistical results
- You need access to specialized statistical methods
- You want your analysis to be reproducible and self-documenting
- You are producing reports, papers, or visualizations as outputs
- Your collaborators or field use R as a standard tool
R may not be the best choice when:
- You need to build a production software system
- Performance on very large datasets (billions of rows) is the primary concern
- Your team already works in Python and integration matters more than statistical depth
- You are building real-time systems or embedded applications
This book assumes R is the right tool for your work. If you are an analyst, researcher, or data-oriented professional who needs to move from spreadsheets to a reproducible, scriptable workflow, R is an excellent choice.
R is a language for thinking with data. Its design prioritizes interactive exploration, statistical modeling, and clear communication of results. This makes it different from languages designed for building software systems. Understanding what R is for helps you use it well instead of fighting its design.
Scripts vs. Spreadsheets
If you are coming from a spreadsheet background, the shift to R involves a fundamental change in how your work is recorded.
In a spreadsheet, your analysis lives in the cells. The formulas, the filters, the sorts, the manual edits — they are all embedded in the workbook. Some are visible; many are hidden. If you delete a row, it is gone. If you overwrite a formula, the original is lost. The spreadsheet records the current state of the data, not the history of what you did to it.
In R, your analysis lives in the script. The data file sits untouched in a folder. The script reads it, transforms it, analyzes it, and produces output. If you want to change something, you edit the script and rerun it. The original data remains unchanged. The script is a complete, readable record of every analytical decision.
This difference has practical consequences:
- Reproducibility — Difficult — steps are manual and unrecorded — Built in — the script is the record
- Auditing — Requires tracing hidden formulas — Read the script from top to bottom
- Reuse — Copy the workbook and edit manually — Run the same script on new data
- Collaboration — One person edits at a time; version confusion — Version control tracks every change
- Scale — Slows down with large data — Handles large data without visual rendering
This does not mean spreadsheets are useless. They are excellent for small, one-off calculations, for data entry, and for sharing simple tables with non-technical collaborators. But they are not built for analytical work that needs to be reproduced, reviewed, or scaled. R is.
R in Context: How It Relates to Other Tools
You may wonder how R compares to Python, the other dominant language for data analysis. Both are capable tools, and many professionals use both. Here is a simplified comparison:
- R has deeper statistical infrastructure, a more mature visualization ecosystem (ggplot2), and stronger integration with academic publishing workflows. Most statisticians publish reference implementations in R.
- Python has broader general-purpose capabilities, a larger machine learning deployment ecosystem, and more natural integration with software engineering workflows.
For the work this book covers — statistical analysis, data exploration, visualization, and reproducible reporting — R is the more natural fit. If your career later takes you toward production machine learning systems or software engineering, you may add Python. The two languages complement each other more than they compete.
You may also encounter tools like SPSS, SAS, or Stata in your field. These are commercial statistical packages with their own scripting languages. R can import data from all of them (via the haven package) and replicate most of their functionality. The advantage of R is that it is free, open-source, and has a vastly larger package ecosystem.
Quotes to share
If your analysis lives in spreadsheets, every new dataset means repeating the same clicks and hoping you remember each step.
Free to read. No account required.