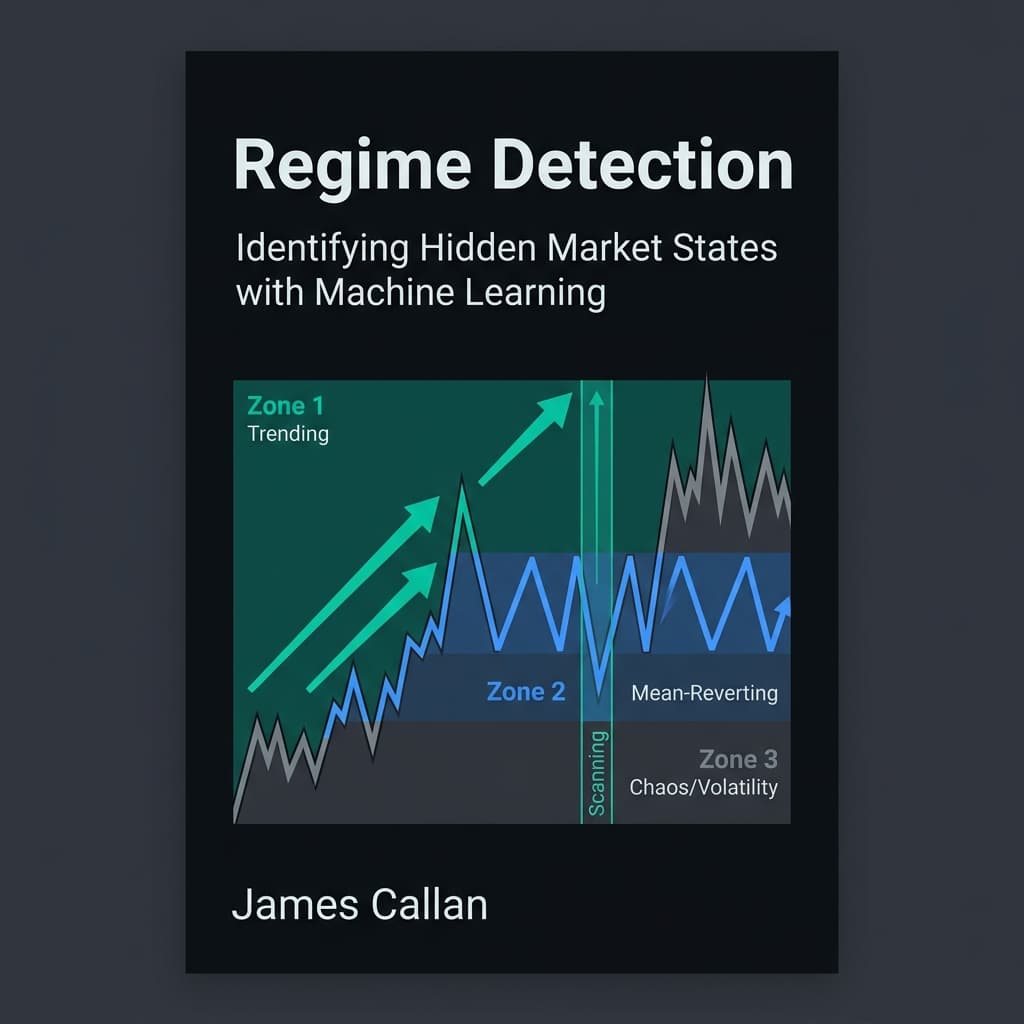
Free first chapter
Market Regime Detection
Hidden Markov Models and Adaptive Strategy Switching
Read the first chapter in your browser. It's free, with no account and no email needed.
Free to read. No account required.
About this book
Every trading strategy has conditions where it works and conditions where it falls apart. Many systems ignore this, running the same strategy and sizing whether the market is trending, mean-reverting, or in crisis.
Market Regime Detection teaches you to identify, model, and act on changing market states. You begin with why regimes matter and how to think about them. You then learn to model hidden market states with Hidden Markov Models in Python, so that you can detect states with evidence instead of guesswork. The final part connects those states to action, showing how to switch strategies and adjust allocation as conditions change, and how to evaluate that adaptive approach across historical periods.
You will come away with a regime-aware research workflow: define states, detect them, link them to suitable strategies, and test the results. It is written for readers with Python, probability, and backtesting experience, and it teaches method rather than promising returns.
Look inside
A regime-aware research framework that detects market states, links states to suitable strategies, and evaluates adaptive allocation across historical market periods.
How to Use This Book
Every trading strategy has market conditions where it works and conditions where it fails. Most traders know this intuitively but build systems that ignore it — running the same strategy, the same sizing, and the same parameters regardless of whether the market is trending, mean-reverting, or in crisis. This book teaches you to identify, model, and act on changing market regimes so that strategy selection, position sizing, and allocation decisions are conditioned on the current market state.
The goal is not to memorize one model. The goal is to learn a regime-aware workflow: define states, detect them with evidence, and connect them to strategy and allocation decisions. By the end, you will have a framework for building adaptive systems that respond to structural market changes rather than overfitting to recent history.
Read linearly on the first pass because each chapter depends on the previous one.
Who This Book Is For
- Intermediate to advanced quantitative traders or researchers
- Practitioners with Python experience and working familiarity with probability, time series, and backtesting
- Readers who want strategies that adapt to market conditions rather than assuming stationarity
Prerequisites
- Python data analysis workflow (pandas, numpy, scikit-learn)
- Basic probability and statistics
- Familiarity with time series features and backtesting
- Working knowledge of common trading strategy types
Environment Setup
Use a Python environment with standard data, statistics, visualization, and modeling libraries.
- Data — pandas, numpy
- Modeling — scikit-learn, hmmlearn, lightgbm
- Visualization — matplotlib, seaborn
- Statistics — statsmodels, scipy
- Clustering — scikit-learn, hdbscan
Keep datasets, notebooks, and outputs organized so every figure, table, and experiment can be reproduced. Document the dataset source, preprocessing assumptions, and evaluation split for each example.
Chapter Roadmap
- 1. Why Regimes Matter — Market-state taxonomy, intuition for regime-conditioned thinking — Clear regime definitions and state framework
- 2. Modeling Hidden Market States — Statistical and unsupervised detection methods, evaluation — Evidence-based regime detection workflow
- 3. Adaptive Strategy Switching — Mapping states to strategies, sizing, adaptive evaluation — Regime-conditioned allocation and strategy system
Reading Strategy
Work through the exercises rather than skimming them. Chapter 1 builds the conceptual frame. Chapter 2 moves into statistical and unsupervised detection methods. Chapter 3 turns detected regimes into adaptive trading decisions and evaluation logic. The exercises are where you test whether a regime concept holds up in data instead of sounding plausible in prose.
Why Regimes Matter
A quantitative researcher spends three months developing a momentum strategy on the S&P 500. The backtest is clean: a Sharpe ratio of 1.4 over five years, steady equity growth, reasonable drawdowns. She deploys the strategy in January 2020. For six weeks, the model performs as expected. Then, in the span of twelve trading days between February 19 and March 9, the S&P 500 drops more than 25 percent. The strategy does not hedge. It does not reduce exposure. It continues issuing long-momentum signals into a market that is no longer behaving like the one the model was trained on. By mid-March the live equity curve has given back two years of simulated gains.
The model was not poorly built. The features were sound, the backtest methodology was disciplined, and the execution pipeline was reliable. The problem was not a coding error or a data leak. The problem was an assumption: the strategy treated the market as a single statistical environment — one set of return dynamics, one volatility profile, one correlation structure — and designed its entry, exit, and sizing logic for that environment alone.
That assumption is wrong. Markets cycle through structurally different behavioral states. A market that is trending upward with low volatility rewards different strategies than a market that is falling with expanding volatility or a market that is moving sideways with compressed ranges. These states are not random noise. They persist. They recur. And they change the rules of the game while the game is still being played.
This chapter builds the foundation for the rest of the book. Before we detect regimes with statistical models, before we build adaptive allocation systems, we need to answer three questions: What is a regime? Why do regimes break static strategies? And what observable features allow a practitioner to distinguish one regime from another? Everything that follows depends on getting these answers right.
- Define a market regime in terms of observable statistical behavior and explain why the concept is useful for trading
- Identify four core regime categories and describe their behavioral fingerprints
- Explain why a static strategy degrades when market state changes
- Compute rolling indicators that distinguish between trending and mean-reverting environments
- Construct a basic regime dashboard from a small set of rolling features
- Recognize common regime-labeling mistakes and explain why false precision is dangerous
The One-Strategy Illusion
Most systematic trading strategies are designed for a particular type of market behavior. A trend-following strategy needs directional moves that persist long enough to capture. A mean-reversion strategy needs prices that overshoot a stable level and snap back. A volatility-selling strategy needs realized volatility to remain below implied volatility. Each of these strategies carries an implicit assumption about what the market is doing right now.
The problem is that the market does not stay in one mode. Periods of calm, directional movement give way to chaotic selloffs. Tight, range-bound markets eventually break out. Low-volatility regimes are followed by high-volatility regimes. If you hold a single strategy constant across these transitions, you are guaranteed to encounter stretches where the strategy's core assumption is violated — and during those stretches, the strategy does not degrade gracefully. It fails.
Why static strategies fail
Consider a concrete example. A simple trend-following rule goes long when the 20-day moving average crosses above the 50-day moving average, and goes short when it crosses below. In a trending market — say, the steady rise of the S&P 500 from mid-2016 through early 2018 — this rule produces clean entries with relatively few whipsaws. The moving averages separate, the position stays on, and the strategy captures the directional move.
Now place the same rule into a choppy, range-bound market — the kind that characterized much of 2015 or mid-2011. The moving averages cross frequently. Each crossover triggers a trade, but the market reverses before the move develops. The strategy generates a stream of small losses, each one individually manageable but collectively destructive. Transaction costs compound the damage.
The strategy did not become worse. The market became different. The distribution of returns shifted: from a state with positive autocorrelation and sustained moves, to a state with negative autocorrelation and frequent reversals. The strategy was designed for the first distribution and has no mechanism to recognize or adapt to the second.
A strategy's edge is conditional on market state. When the state changes and the strategy does not, the edge disappears — and what remains is often a systematic source of loss, not a neutral absence of profit.
The cost of ignoring state changes
The cost is not limited to underperformance. A strategy that is mismatched to the current regime can actively lose money in a structured way. Mean-reversion strategies in trending markets keep fading a move that does not reverse. Trend-following strategies in choppy markets keep chasing moves that do not persist. Volatility-selling strategies in volatility expansion regimes take on exactly the risk they were designed to avoid.
Quotes to share
Every trading strategy has conditions where it works and conditions where it falls apart.
Free to read. No account required.